
STORMWATER ISSUES
What is stormwater runoff?
When it rains, stormwater can either infiltrate the ground, eventually evaporate, or runoff. As natural ground cover is converted to buildings, driveways, parking lots, roads, etc… (i.e. impervious surfaces), stormwater runoff increases, carrying a variety of pollutants that are eventually delivered untreated directly into our streams, rivers and lakes. The increased volume of water, which reaches waterbodies more quickly when traveling over impervious surfaces, can also cause or exacerbate flooding, erosion and sedimentation. Steep slopes in WNC increase both the quantity and velocity of runoff in our communities.
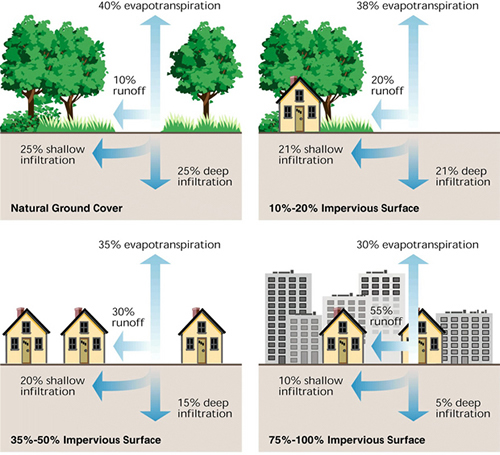
Typical increase in stormwater runoff due to development. Source: FISRWG.
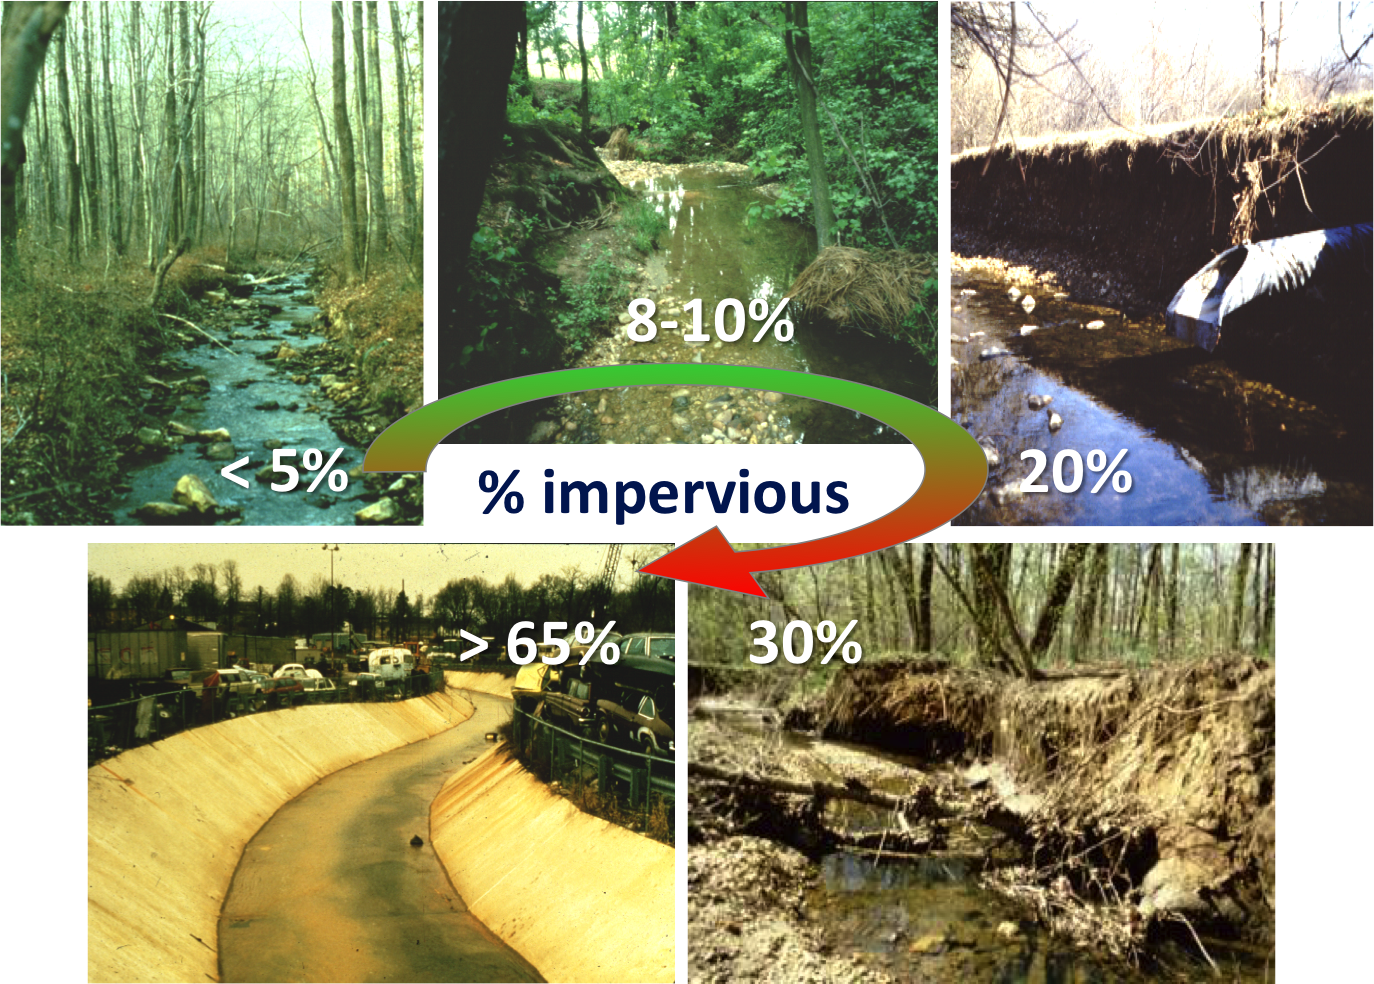
Increasing impervious surface and unmitigated stormwater discharge results in physical, chemical and biological stream degradation. Source: Horsley Witten Group.
Gallons of runoff from common impervious surfaces during the peak intensity of different types of storms in Asheville. Design storms for stormwater management are expressed in yearly recurrence intervals (e.g. 2yr, 10yr, 25yr).
| Contributing Area (ft2) | 2yr-storm | 10yr-storm |
25yr-storm |
| Residential Roof (1200) | 3397 | 4605 | 5294 |
| Single Car Driveway (200) | 566 | 767 | 882 |
| Large Commercial Roof (50,000) | 141,528 | 191,862 | 220,582 |
| Large Parking Lot (100,000) | 283,056 | 383,724 | 441,164 |
| 1 Mile Secondary Road (264,000) | 747,267 | 1,013,031 | 1,164,673 |
Note: Normally runoff is expressed in cubic feet, there are 7.48 gallons in 1 cubic foot. Formula used for the above volumes: V = (.95*A*I) *7.48, where A = area in square feet and I = intensity as (inches/hour)/12. The runoff coefficient (.95) for impervious surface means that 95% of rainfall is expected to runoff. The peak intensity values for Asheville (4.78, 6.48, 7.45 in/hr for 2, 10, and 25 yr-storms respectively) were obtained from the NC Department of Agriculture’s General Stormwater BMP Design Considerations.
Pollutants
Sediment is the most common pollutant affecting our waterways; in western North Carolina 80% of streams are impaired due to sediment. It takes 500 years to develop topsoil needed to grow plants and food, which can be lost in one storm if erosion control measures are not taken. Sediment can also contain and carry harmful pollutants (Haywood Waterways Association It’s not just dirt).
Typical stormwater pollutants carried in stormwater and sediment.
| Pollutant Type | Examples | Common Sources |
| Metals | Zinc, cadmium, copper, chromium, lead | Industrial waste, mining, automobile parts and fluids |
Nutrients & Biochemical oxygen demand (BOD) |
Nitrogen, phosphorus | Grass clippings, fallen leaves fertilizers, farm-animal waste, faulty septic systems |
| Pathogens | Viruses, bacteria, protozoa | Domestic sewage, animal waste |
| Polycyclic Aromatic Hydrocarbons (PAHs) | Compounds found in soil, and also created by the incomplete combustion of organic chemicals | Auto emissions, elicit discharges, asphalt, coal tar sealants |
| Sediment | Sand, soil, and silt | Grading, construction, vegetation removal |
| Salts | Sodium chloride, calcium chloride | Road salt, fertilizer |
| Volatile Organic compounds (VOCs) | Large group of carbon-based chemicals that easily evaporate at room temperature | Crude oil, insecticides, varnishes, paints, gasoline products, degreasers |
Note: This website provides a very detailed overview of these pollutants and their transport, exposure, and metabolic pathways, as well as their effects on people and the environment.
Thermal pollution, caused by stormwater flowing over hot asphalt and into a nearby waterway or by poor riparian cover (i.e. the absence of streamside vegetation), is also an important issue in WNC. Trout and the species upon which they depend prefer cool water, below 70 °F. An increase of 5-7 °F can kill insects and lead to trout starvation. Asphalt can reach temperatures between 120-150 °F, and associated runoff can raise stream temperatures well above safe levels. A study of 36 streams in the southern Appalachians showed unique endemic fish species and overall biological diversity were decreased in streams with reduced riparian cover, a surrogate measure of disturbance by agriculture and urbanization (Scott 2006).
Examples of thermal pollution in Haywood County
| Site | Range (°F) | Days > 70°F |
Richland Creek |
33.6 - 80.1 | 144 |
| Raccoon Creek | 33.2 - 76.3 | 129 |
Source: Haywood Waterways Association State of the Watershed 2013.
Flooding
Stormwater runoff impacts flooding in multiple ways. As more development occurs and more natural cover is converted to impervious surface, more water runs off increasing the volume of water in our streams and rivers. Impervious surfaces also increase the velocity of runoff, and both the increased volume and velocity of stormwater cause higher and earlier peak discharges (i.e. the maximum flood stage or depth for a particular storm) in receiving waters. Stormwater-related sedimentation also reduces the depth of waterways, further exacerbating flooding.
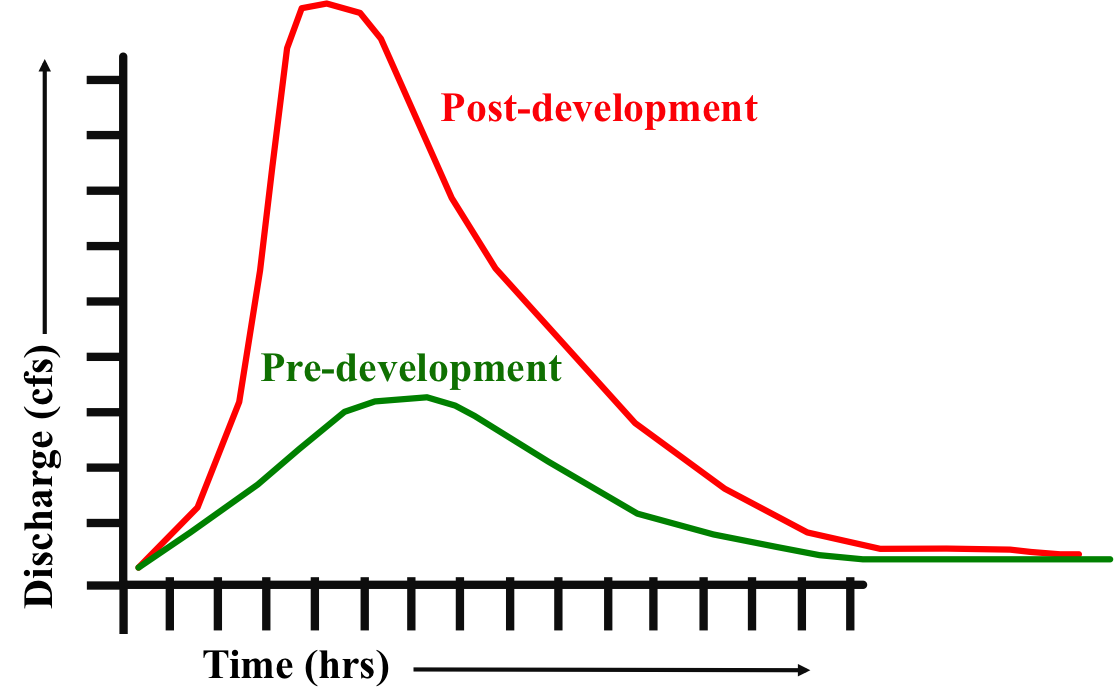
Idealized hydrograph comparing post- and pre-development peak discharge. Source: Adapted from David Nyman, ENSR.
References
Scott, M.C. Winners and losers among stream fishes in relation to land use legacies and urban development in the southeastern U.S. Biol. Conserv. 2006, 127, 301–309.